Reconstruction of a genome-scale metabolic model
In the Indian T2D gut microbiota, species like L. ruminis, P. copri, M. smithii, and F. prausnitzii showed an altered abundance and exhibited changes in the metabolic activities associated with carbohydrate utilization and SCFA production18. To explore microbial metabolic behavior associated with Indian T2D, genome-scale metabolic modelling of L. ruminis, P. copri, M. smithii, and F. prausnitzii was implemented. Initially, the draft models were reconstructed for each microbial species based on the respective genome annotation profile. The draft GEMs of P. copri, L. ruminis, M. smithii, and F. prausnitzii comprised 15, 4, 9, and 18 unbound reactions, respectively. These reactions involve thermodynamically infeasible cycles (TIC) and do not result in the consumption or production of any metabolites29. In order to identify these TICs in our GEMs, we disabled all nutrient uptake reactions for the microbes and performed flux variability analysis (FVA). FVA determines the flux ranges for each reaction, and those hitting either the lower or upper bound are defined as unbound reactions39. In order to eliminate the unbound reactions, duplicate reactions were removed, lumped reactions were turned off, and reactions were selectively turned on or off based on available cofactor specificity information from MetaCyc40 and ModelSEED reaction databases41. In addition to unbounded reactions, the draft GEMs also included unbalanced reactions. Maintaining charge and mass balance in reactions is crucial for enhancing the predictive accuracy of GEMs42. In order to maintain elemental and charge balance in biochemical reactions, each metabolite was initially assigned accurate chemical formula and charge by consulting CHEBI (Chemical Entities of Biological Interest)43, PubChem, and BiGG Database44. Furthermore, the databases (CHEBI, BiGG) were employed to rectify the proton-imbalanced reactions by adding or removing one or more protons on either the reactant or product side. However, the reaction stoichiometry was adjusted for the remaining imbalanced reactions to guarantee that the number of atoms on both sides of the reaction was equal. These corrections led to 56, 49, 16, and 42 balanced reactions in P. copri, L. ruminis, M. smithii, and F. prausnitzii, respectively. The model also included orphan and dead-end metabolites lacking proper metabolic pathways, accounting for an average of 2–5% of the total metabolites across all four GEMs. These metabolites were either eliminated from the models or integrated into the relevant metabolic pathway to improve the quality of the model. Moreover, correcting the reversibility of all essential biochemical reactions is necessary to enhance the accuracy of the metabolic network. The correct direction was assigned by adjusting the upper and lower limits for each individual reaction by referring to the ModelSEED database and MetaCyc. Assigning appropriate direction to biochemical reactions greatly enhances the metabolic flux flow through the biochemical pathways. The model exhibited a significant proportion, ranging from 20 to 50%, of blocked reactions across all microbial models. These blocked reactions resulted from the missing reactions in the central metabolic network. The GEMs of P. copri, L. ruminis, M. smithii, and F. prausnitzii exhibit reaction gaps, comprising 74, 31, 136, and 89 reactions, respectively. The gaps in the respective metabolic networks were addressed by incorporating the missing biochemical reactions guided by the KEGG pathway database. Curation of the metabolic networks enhances the accuracy, predictive capability, and biological relevance of these models (Fig. 1a). The biomass production of all the curated GEMs was optimized through flux balance analysis (FBA), a mathematical approach for analyzing the flux of biochemical reactions through a metabolic network. Biomass production was considered as the objective function while optimizing the individual microbial models of P. copri, L. ruminis, M. smithii, and F. prausnitzii using FBA. The biomass equation of the GEMs represents the combination of precursor molecules, which ideally reflect the molecular makeup of the microorganism. The minimal media was used during the optimization of the objective functions of P. copri (DSM 18205), L. ruminis (ATCC 25644), M. smithii, and F. prausnitzii which showed an in silico growth rate of 0.79 mmol/gDW/h, 0.012 mmol/gDW/h 0.25 mmol/gDW/h and 0.33 mmol/gDW/h respectively (Fig. 1b). The predicted in silico growth of the individual models showed good agreement with previously reported experimental observations37,45 as well as with the AGORA models46 (Table S1).
Model characteristics and validation. (a) The plot represents the total number of genes, metabolites and reactions present in all individual models. (b) Model validation plot shows the comparison of the experimental growth rate and in silico growth rate of all individual models. The horizontal axis represents the growth rate (h−1), and the vertical axis shows the individual microbes.
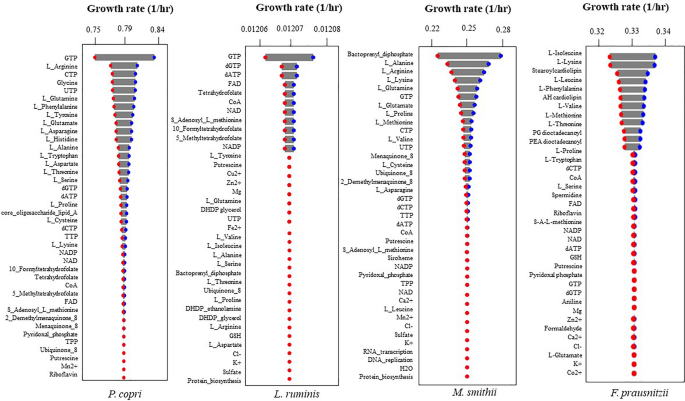
Moreover, a biomass sensitivity assay was performed to check the integrity of the biomass formulation of individual GEMs. During the biomass sensitivity analysis, the coefficient of each biomass precursor was altered by ± 20%, and FBA was performed to estimate the flux through the biomass reaction. The alteration of the biomass precursor by ± 20% showed a change in the biomass formation of 1.92%, 0.65%, 2.57%, and 0.175% in P. copri, L. ruminis, M. smithii, and F. prausnitzii, respectively. The biomass flux was most sensitive towards different AAs, such as arginine, glutamine, alanine, lysine, and methionine, alongside nucleotides like GTP, CTP, and UTP. (Fig. 2). As the amino acids and nucleotides hold a significant fraction of ~ 30% of the biomass equation, the models showed a higher sensitivity towards these precursor molecules (Table S2). Despite the ± 20% alteration in the coefficients of biomass precursor molecules, the growth rate experiences minimal fluctuations between ~ 1 and 3%. This minute alteration in the growth rate stems from flux readjustments within the metabolic network, showing the robust metabolic activity of the individual GEMs.

Biomass sensitivity analysis. The plot shows the altered growth rate of the individual models with respect to varied coefficients of the biomass precursor molecules by 20%. The lowest growth rate achieved by altering the coefficient of individual biomass precursor is represented by the red dot, and the highest is in the blue dot. The horizontal axis represents the biomass precursor molecules, and the vertical axis shows the altered microbial growth rate: (a) P. copri. (b) L. ruminis. (c) M. smithii. (d) F. prausnitzii.
Reconstruction of genome-scale community metabolic model
Community metabolic modelling combines the biochemical networks of multiple microorganisms to predict their interactions and metabolic capabilities in a community setting. This approach aims to simulate the metabolic behaviour of microbial communities in various environments and gain insights into their structure and function. Hence, the microbial GEMs were combined into a compartmentalized community model to understand the altered metabolic behaviour of microbial consortia in healthy and T2D gut environments. The reconstructed community model encompasses 3578 genes, 4163 reactions, and 4399 metabolites in four microbe-specific compartments (Fig. 1a). The individual microbial biomass reactions served as precursors for the community biomass reaction. The biomass production of the community metabolic model was optimized by maximizing the biomass reaction under average human diet (AHD) media (Table S3). The AHD media was designed to mimic the biochemical condition of the human gut microenvironment and can provide a more realistic view of the metabolic flux distribution of the microbial community model. The community model showed a growth rate of 0.33 h−1 in the AHD media (Fig. 3). Further, to understand the condition-specific metabolic activity, microbial abundance with respect to healthy and T2D gut environments was implemented to weigh the biomass precursor coefficient in the community model (Table S4). The healthy and T2D microbial community models showed a growth rate of 0.32 h−1 and 0.47 h−1, respectively.

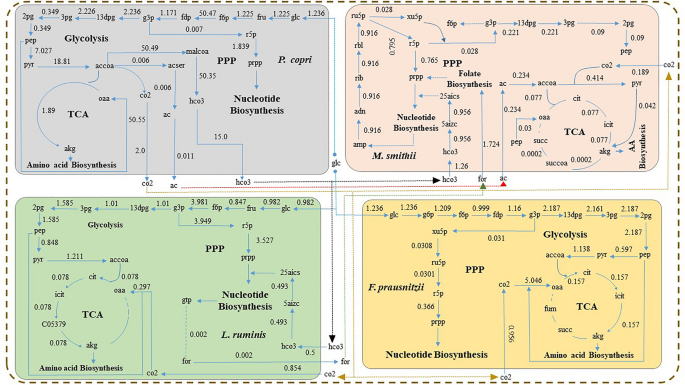
Community-level metabolic interaction between individual gut microbiota in minimal media. This network represents the metabolic interaction between the microbes grown in the minimal media. P. copri, L. ruminis, M. smithii, and F. prausnitzii are represented in four different compartments, i.e., blue, green, and red, respectively. Acetate (red), carbon dioxide (yellow), bicarbonate (black), formate (green), and glucose (blue) are exchanged between the individual microbes.
The community model primarily consumes glucose and amino acids from the AHD media in both healthy and T2D conditions. The T2D gut microbiota exhibits a significant decrease in glucose uptake rate by 39.34% and an increase in amino acid consumption rate by 18.82% compared to the healthy control. The variations in the consumption rate of glucose and amino acids, as predicted by our community model, can alter the concentration of these biomolecules in the human body fluid. The imbalance in glucose and amino acid concentrations within the human body poses a potential risk for Type 2 Diabetes, as highlighted in experimental studies47. On the other hand, the community model within the T2D gut environment reveals an altered metabolic exchange pattern between individual microbes when compared with the healthy microbial community. The altered metabolic exchange pattern was accompanied by shifts in the metabolic flux through the biochemical networks of the microbial community. In contrast to the healthy gut microbiota, the microbial community associated with the T2D gut environment exhibited diverse flux rates in reactions involving amino acids, SCFAs, vitamins, alcohols, CO2, and bicarbonate exchange between the individual microbes present in the community model. Moreover, the community model in the T2D gut environment also showed reduced production of SCFAs, vitamins, and bicarbonates by 64.32%, 5.54%, and 62.5%, respectively. As the SCFAs and vitamins are essential biomolecules that regulate a vast range of metabolic processes, a reduction in their production flux leads to metabolic dysbiosis in the T2D gut environment. Moreover, the alteration in the bicarbonate concentration can hamper carbohydrate metabolism, which has a considerable effect on the T2D condition. Further analysis of the community model will help comprehend the interconnection between the microbial consortia and assist in predicting the altered biochemical activities of inter-microbial metabolic interactions in the T2D gut environment.
Flux space alteration within the biochemical pathways of healthy control and T2D gut microbiota community metabolic model
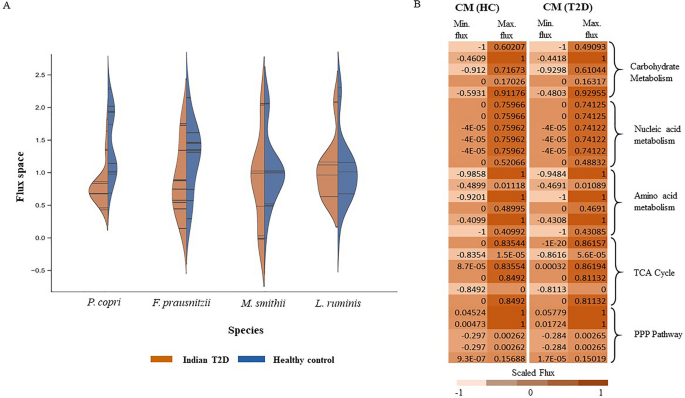
An imbalance in the gut microbial composition can influence the metabolic flux profile of the gut microbiota. Several experimental studies have reported alterations in the gut microbial composition in individuals with Type 2 Diabetes9. To understand how the altered microbial composition can influence the metabolic flux profile in T2D gut microbiota, the Flux Variability Analysis (FVA) was performed. The changes in flux space through the biochemical network of a microorganism can lead to the increase or reduction of certain metabolic activities in the microbe. FVA elucidates the fluctuations in the permissible flux range and enables the determination of condition-specific flux space alteration in metabolic models. Analyzing alterations in flux space through the metabolic reactions of each microorganism in the community helps to identify the crucial microbe-specific metabolic pathways that are affected in the T2D condition. The FVA showed an average of ~ 12.50% of reactions have decreased flux space and ~ 5.61% of reactions have increased flux space in the community model in the T2D compared to the healthy gut environment (Fig. 4, Table S5). In the community model, the decreased flux space was associated with different biochemical pathways like pantothenate and CoA biosynthesis, carbohydrate, amino acid, and fatty acid metabolism. Pantothenate (vitamin B5) biosynthesis is an essential checkpoint for carbohydrate metabolism as it plays a vital role in coenzyme A (CoA) production, an essential cofactor in different crucial biochemical reactions. The community model in the T2D condition showed a reduced flux space in pantothenate biosynthesis by 41.44%, 29.36%, and 5.92% in P. copri, F. prausnitzii, and M. smithii, respectively. The distorted pantothenate metabolism of these two community members impaired the CoA biosynthesis of the respective microbes, ultimately affecting glucose metabolism. Therefore, the flux space of biochemical reactions associated with glucose metabolism in the community model has exhibited a reduction of 32.19%, 16.25%, and 4.32% in P. copri, F. prausnitzii, and M. smithii, respectively. Low glucose metabolism by the gut microbiota leads to a high concentration of unutilized glucose retained in the body fluid, which triggers the T2D condition. For instance, the crucial reaction of glucose metabolism that converts phosphoenolpyruvate to pyruvate was reduced by 45.23%, 34.87%, and 21.61% flux space in P. copri, F. prausnitzii, and M. smithii models, respectively. The formation of pyruvate from glucose marks the initiation of various biochemical pathways, including TCA, amino acid, and fatty acid metabolism. Hence, the reduction of glucose metabolism restricts the carbon flow in the subsequent metabolic pathways, which alters the flux distribution in amino acid and fatty acid biosynthetic pathways (Fig. 5). The community model shows a significant reduction of flux space in amino acid biosynthesis, specifically BCAAs, including valine, leucine, and isoleucine. The biochemical reactions associated with BCAA metabolism showed 9.65%, 12.16%, and 4.32% reduced flux space in P. copri, F. prausnitzii, and M. smithii, respectively. Specifically, the metabolic reaction converting glutamate into leucine showed a reduced flux range of 6.19% in M. smithii (Table S5). This shift in the flux space within the BCAA metabolism can lead to an altered biosynthesis of the respective amino acids, which can give rise to various health complications and elevate the risk of T2D, as demonstrated in multiple epidemiological studies48,49,50,51,52. Apart from the amino acid metabolism, the altered flux flow in the carbohydrate metabolism also affected the fatty acid metabolism biosynthesis in the T2D community environment. An 8.23%, 56.19%, and 84.23% reduction in the SCFA metabolism (specifically acetate and butyrate) was observed in P. copri, F. prausnitzii, and M. smithii, respectively. Acetate and butyrate are crucial short-chain fatty acids (SCFAs) that help enhance glucose and lipid metabolism5. Hence, the reduced concentrations of these fatty acids in the body fluids can impact glucose metabolism and lead to biochemical complications in T2D patients. Overall, the FVA helps to identify crucial biochemical pathways in the microbial community where the flux range was affected due to metabolic dysbiosis in the T2D condition. Moreover, it also provided systems-level knowledge on how the alteration of flux distribution in carbohydrate metabolism can affect the interconnected biochemical pathways and alter community metabolism. Therefore, the interconnectivity of the microbial flux distribution pattern and how it affects overall metabolic outcomes in T2D conditions were addressed in the following section.

Altered reaction flux range from healthy control gut microbiota community model to T2D community metabolic models. (a) Alteration of the reaction flux range between the T2D community model (blue) and the healthy control community model (orange) of the human gut microbiota. The vertical axis represents the flux range, and on the horizontal axis, each point represents the individual microbes. (b) The alteration of reaction flux range of several critical metabolic pathways like, carbohydrate metabolism, nucleotide metabolism, amino acid metabolism, TCA cycle and PPP pathway between the healthy control and T2D gut microbiota community model.

FVA reveals altered microbial biochemical pathways in T2D gut microbiota compared to healthy control. The altered flux space in the biochemical pathways associated with glucose metabolism in P. copri and F. prausnitzii. The red arrows indicate the decrease in the flux space.
Assessing the altered metabolic activities of the T2D gut microbial community
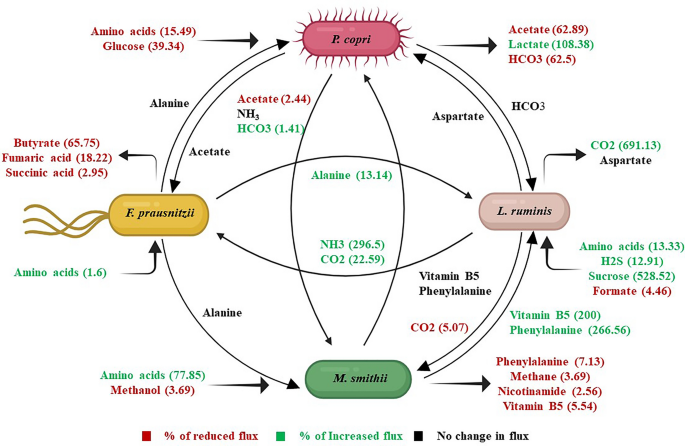
The biochemical pathways of gut microbes, specifically glucose, SCFA, and AA metabolism, were altered in diabetic patients compared to healthy individuals, as determined by flux space analysis. These varied metabolic activities of the gut microbial community can influence the flux distribution pattern of human biochemical pathways, which can play crucial roles in T2D. Therefore, the community-level flux analysis was performed to better understand the altered metabolic activities of the microbial community in the T2D gut environment compared to the healthy control (Table S6). Moreover, the assessment of the pathway-level map helps to explore the metabolic interconnection between human gut microbiota and T2D. The analysis of community-level flux distribution indicates that the microbial community in the human gut predominantly utilizes amino acids, vitamins, short-chain fatty acids (SCFAs), and glucose as primary metabolic substrates. However, varied rates of substrate consumption were noticed in the microbial community in accordance with the specific gut environment (Table S7). This altered substrate consumption influenced both the metabolism of the microbial community and the metabolic interactions among the individual microbes. We also have identified the alteration in the inter-microbial metabolic exchange pattern for different essential metabolites in the community environment. For instance, P. copri utilizes glucose as its primary carbon source and generates various short-chain fatty acids (SCFAs) and bicarbonate. A glucose consumption rate of 9.265 mmol/gDW/h was observed for P. copri in the community model in the healthy gut environment. In contrast, a reduced glucose intake of 5.62 mmol/gDW/h by P. copri was observed in the community model in the T2D gut environment (Fig. 6). As P. copri is the only glucose-consuming microbe in the microbial community, the reduction in its glucose consumption rate can increase the glucose concentration in the human body fluid. Consequently, the reduced glucose uptake rate in P. copri disrupts the flux profiles of its inherent metabolic pathways, resulting in a decline in biochemical activities related to SCFAs and bicarbonate metabolism. The production of major SCFA, namely acetate, was reduced by 62.89% in the T2D gut microbial environment compared to the healthy condition. The reduced production of SCFA impacts the inter-microbial exchange and cross-feeding of acetate—between P. copri and M. smithii in the community environment. In the T2D condition, the exchange of acetate between this microbial pair was decreased by 2.44%, respectively. The reduced production and exchange of acetate and formate eventually leads to a lower accumulation of these SCFAs in the gut environment. As acetate is one of the major SCFAs that maintain intestinal mucosa integrity4,13 and improve glucose and lipid metabolism5, a reduction in their concentration within the T2D gut environment may impair glucose metabolism, thereby influencing blood sugar levels. Furthermore, the acetate produced by P. copri also acts as a major substrate for F. prausnitzii in the microbial community. By getting assistance from the gut microbial community, F. prausnitzii produces butyrate. Interestingly, it was observed that F. prausnitzii shows a reduced production of butyrate by 65.75% in the T2D gut environment compared to the healthy control. Different experimental studies have reported that butyrate has a similar effect as metformin in reducing insulin resistance and improving glucose metabolism53. Therefore, the reduced concentration of butyrate can play a crucial role in impaired insulin sensitivity and reduced glucose metabolism. In addition to SCFAs, P. copri also produces bicarbonate, which L. ruminis and M. smithii subsequently consume as a metabolic substrate. P. copri and M. smithii exhibited an elevation of 1.41% in bicarbonate exchange in the gut environment of T2D as compared to healthy control. The increased bicarbonate consumption by M. smithii in the community environment led to a significant decrease (62.5%) in bicarbonate accumulation in the T2D gut microbiota compared to the healthy environment. The decreased bicarbonate concentration disrupts insulin secretion, which can lead to altered glucose regulation in T2D patients, as mentioned in earlier studies54. Moreover, the lower bicarbonate flux also restricts the carbon flow to the carbohydrate metabolism pathway and ultimately hampers the metabolic homeostasis in the T2D condition.

Community-level metabolic interaction between the crucial gut microbiota. (a) This network represents the altered metabolic interaction in the microbial community between healthy and T2D gut environments. The values represent the percentage of flux change between two conditions. Red-colored metabolites show decreased flux, green shows increased flux, and black shows no change in flux.
Several other critical metabolic byproduct exchanges, including phenylalanine, vitamin B5, and CO2, have also been identified in the T2D community environments. M. smithii acts as the primary producer of these metabolic compounds, which L. ruminis consumes in the community environment. F. prausnitzii, along with M. smithii, provides positive metabolic assistance to L. ruminis, resulting in its higher abundance in the T2D gut environment. This increase in the abundance of L. ruminis in the microbial community showed an enhanced sucrose consumption of 528.52%. Sucrose is a prominent substitute for glucose. An increase in sucrose consumption has resulted in a 39.34% reduction in glucose intake. Hence, this high consumption of sucrose and low glucose intake rate result in an elevation of glucose concentration in the body fluid, potentially increasing complications in T2D.
Similarly, the metabolic exchange profiles of vitamin B5 have also been altered in the T2D gut environment. Overall, a 6% reduction in the production of vitamin B5 was found in the T2D gut environment compared to the healthy control. These lower vitamin B5 production profiles impacted the exchange flux between M. smithii, L. ruminis, and P. copri, leading to an overall 5.54% decrease in vitamin B5 concentration in the body fluids. As vitamin B5 acts as an essential precursor for CoA biosynthesis, the reduced concentration in the human body can hinder protein, carbohydrate, and lipid metabolism in T2D, as pointed out in earlier studies55,56.
Consequently, the community model in the T2D gut environment also showed altered concentrations of various BCAAs, where the consumption of valine, leucine, and isoleucine decreased by 9.23, 15.16%, and 8.29%, respectively (Fig. 6). The reduction in amino acid intake by the microbial community implies an elevation in BCAA levels within the human body fluid, which has also been reported in earlier experimental studies of type 2 diabetes patients52,57. Hence, the community-level metabolic flux analysis reveals that maintaining the concentration of several critical metabolites, like SCFAs, BCAAs, vitamins, and bicarbonate, in the body fluids is critical in managing T2D complications. The alteration in the concentration of these essential metabolites in the body fluids can be conceded as biomarkers for Indian T2D. Moreover, the metabolic exchanges between crucial gut microbial species help to balance the metabolite concentration and biochemical homeostasis in the body. Hence, the disruption of the microbial community composition and abundance profiles has a significant impact on worsening the T2D condition. The systems-level knowledge of the microbial community-level flux distribution derived from this study can help manipulate and optimize the microbial biochemical activities for future therapeutic implications.


