

Table of Contents
Study design and participants
The STUDIA trial evaluated whether an advanced meal bolusing approach —a simulation-assisted decision support system (SA-DSS arm) would be superior in TIR to the current best practice, bolus calculation with carbohydrate counting (BC arm). The study was a four-week, single-center, parallel (two-arm), randomized, controlled, prospective trial that evaluated the superiority of SA-DSS over BC on the change in the percentage of time in the target range (TIR, 70–180 mg/dL, 3.9–10 mmol/L) from baseline to the end of the study.
The study was conducted at the Pablo Tobon Uribe Hospital (PTUH), a tertiary referral center in Medellin, Colombia, following the principles of the Colombian medical research regulations and the Declaration of Helsinki. The study protocol42 received approval from the institutional ethics committee under reference number 022021 and was registered on clinicaltrials.gov (NCT05181917 – First Posted date 10/01/2022). All participants provided written informed consent.
Participants were referred to by three university hospitals and ambulatory clinics dedicated to treating people with diabetes. Major eligibility criteria included a diagnosis of T1D with insulin treatment for at least one year, use of continuous subcutaneous insulin infusion (CSII) or multiple daily injections (MDI) for intensive insulin therapy (IIT), prior training in carbohydrate counting and CGM use, HbA1c levels not exceeding 10% in the three months preceding randomization, age of 18 years or older, and being deemed suitable by the investigator to use the app. Key exclusion criteria included pregnancy or the intention to become pregnant during the study period, a possible or confirmed diabetic gastroparesis, chronic renal disease, an estimated filtration rate of 65 ml/min/1.73m2 or less using the Chronic Kidney Disease Epidemiology Collaboration (CKD-EPI) equation, and receiving any glucose-lowering medication other than insulin.
Randomization and group allocation
Following confirmation of eligibility, participants were randomized to the SA-DSS intervention or control condition in a 1:1 ratio using a sequence of computer-generated random numbers via an online randomization service (Sealed Envelope Ltd, London, UK). The sequence was concealed from the investigators. Due to the nature of the investigation, neither participants nor investigators were blinded. Instead, the data analysts were masked.
Admissions
At the screening visit, baseline characteristics were collected, and eligibility was assessed. The study consisted of a two-week run-in period, during which participants continued their usual insulin treatment and used a flash glucose monitor (FreeStyle Libre; Abbott Diabetes Care, Alameda, CA, USA). After the run-in period, all participants were trained on using the STUDIA app and randomized to either the SA-DSS or BC arms for the main four-week protocol phase. During the main study phase, each participant received a weekly follow-up phone call from a study staff member, during which the data was revised and uploaded to a secure server. The study member also discussed continuous monitoring data, inquired about adherence to the app, and addressed any questions regarding the study app and its usage. Upon completing the study, participants were asked to uninstall the app from their phones or return the study device, if applicable.
Study devices and interventions
STUDIA is a non-commercial smartphone app that implements BC and SA-DSS using a straightforward user interface. The app’s dataset was stored in a secure cloud server implemented in the Amazon Web Services (AWS) environment. The study PI performed data quality checks and followed the participants using a web-based platform. The system architecture and components used in the study are shown in Fig. 6. Participants wore flash glucose monitors (FreeStyle Libre; Abbott Diabetes Care, Alameda, CA, USA) to track blood glucose levels.
The HPTU system architecture and components.
The STUDIA app under SA-DSS featured a digital twin (DT) of the user, composed of a set of detailed physiological models describing the rate of glucose appearance from a mixed meal26, hepatic glucose production25, and a glucose-insulin system model integrating the two former to produce a glucose forecast. The study physician, who had also participated in the development of the underlying physiological models, heuristically modified four parameters prior to randomization, using information collected during the run-in period: Fractional glucose effectiveness (\(\:{S}_{g}\)) from glucose dynamics, insulin sensitivity (\(\:{S}_{I})\) from insulin dynamics, and the time lag related to stomach emptying (\(\:{T}_{lag}\)) and energy flow leaving the stomach (\(\:{\dot{E}}_{{8}_{ISO}}\)) from the GI-tract model (refer to the Supplementary Material for additional information). The interpretability of these parameters, together with prior in silico testing of the model, facilitated this personalization. Adjustments were based on clinical judgment and visual inspection of glucose responses to mixed meals and were performed once before study entry. No formal optimization algorithm or standardized error metric was applied, reflecting a pragmatic proof-of-concept approach.
The input screen for the bolus calculator was identical in both arms. At every meal, participants were asked to enter their current CGM value and estimated carbohydrate intake manually, which enabled the automatic calculation of their recommended bolus based on their pre-meal glucose level, personal carbohydrate-to-insulin ratio (CR), correction factor (CF), and target glucose levels. In the SA-DSS arm, participants received a graphical representation of a four-hour post-prandial glucose prediction for the entered meal and bolus based on the user-specific DT. Simulations could be repeated with different carbohydrate estimates at the user’s discretion (Fig. 7, panel A). Participants received only the recommended bolus in the BC arm (Fig. 7, panel B), with the graphical prediction concealed. In either case, the digital twin-based four-hour post-prandial glucose prediction was sent to the server for future analyses.
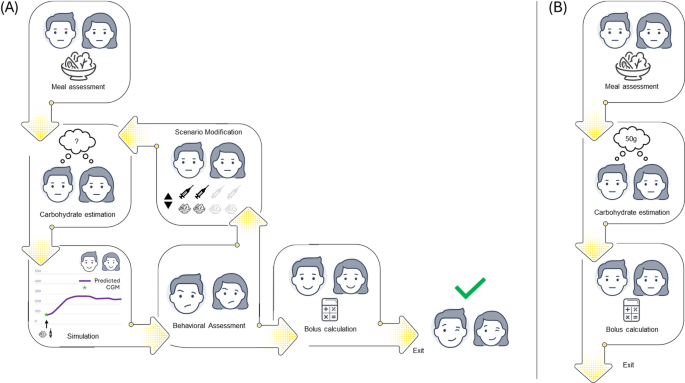
App usage in the two arms. Panel A: simulation-assisted decision support system (SA-DSS). Panel B: Classic bolus calculator (BC).
In the present study, participants manually entered only their estimated carbohydrate intake, which was the sole input required from the user. Protein and fat contributions were incorporated indirectly through fixed proportions relative to carbohydrate intake. These fixed components were derived from previous experimental work and in silico analyses that preceded this trial, as practical methods for patient-level estimation of protein and fat remain insufficiently developed. No image-based food recognition tools were used in this study.
Data and preprocessing
CGM, carbohydrate estimates, and insulin records were collected during the run-in period to establish the baseline characteristics and modify the model parameters to match the postprandial responses of the personalized DT. This resulted in a time-series database for each variable. We preprocessed the data to guarantee unit homogeneity and eliminate common data artifacts, such as outliers and incomplete data entries.
Model structure
The computational model used in the DT engine consisted of two maximal models and a compartmental model integrated into a glucose dynamics equation. The two maximal models describe the macronutrient absorption through the gastrointestinal (GI) tract43 and the role of the liver in glucose homeostasis25, respectively; they provide a detailed description of glucose appearance in the bloodstream in response to a mixed meal and endogenous glucose production from gluconeogenesis and glycogenolysis (Supplementary Tables 1 to 9). The compartmental model describes the subcutaneous insulin delivery via a triangular insulin dynamic, demonstrating good agreement with current insulin analogs with PK/PD44. Figure S5 shows the glucose dynamics and its integration with the complementary models.
Evaluation of the digital twin engine
Deidentified data prospectively collected were used to assess the prediction ability of the model. The data included inputted glucose levels (from the FGM reading) and carbohydrate intake and the returned insulin boluses and model predictions by the app. Only data from participants within the control arm were used for evaluation, since participants within the intervention arm were likely to change their behavior after using the app. Data was preprocessed as in the data collection period, with no excluded CGM per initiation day or any adjustment for bias in nutrient intake45.
We used the following key performance indicators (KPI) to evaluate the prediction performance of the proposed metabolic model:
$$\:RMS{E}^{EP}=\sqrt{\frac{{\sum\:}_{i=1}^{N}{\left({y}_{i}-{\widehat{y}}_{i}\right)}^{2}}{N}}$$
(1)
$$\:MA{E}^{EP}=\frac{{\sum\:}_{i=1}^{N}\left|{y}_{i}-{\widehat{y}}_{i}\right|}{N}$$
(2)
$$\:MAP{E}^{EP}=100\cdot\:\frac{1}{N}{\sum\:}_{i=1}^{N}\left|\frac{{y}_{i}-{\widehat{y}}_{i}}{{y}_{i}}\right|$$
(3)
$$\:aRMS{E}_{PH}=\sqrt{\frac{{\sum\:}_{i=1}^{{N}_{s}}{\left({y}_{i}-{\widehat{y}}_{i}\right)}^{2}}{{N}_{s}}}$$
(4)
where \(\:RMSE\), \(\:MAE\), \(\:MAPE\), and \(\:aRMSE\) stand for root mean square error, mean absolute error, mean absolute percentage error, and accumulated root mean square error, respectively, \(\:{y}_{i}\) and \(\:{\widehat{y}}_{i}\) are the actual FGM value and model estimate at the defined end-point (\(\:EP\)), respectively, with \(\:i\in\:\left\{1,\:\dots\:,N\right\}\) and \(\:N\) the number of evaluated predictions. Equations (1)-(3) are end-point metrics, meaning they assess the metric only at the given endpoint (\(\:EP\)). Equation (4) evaluates the RMSE within the entire prediction horizon (\(\:PH\)) to account for the physiological trajectory to reach the endpoint. \(\:{N}_{s}=PH/{T}_{s}\) is the number of samples within the \(\:PH\) with \(\:{T}_{s}\) the sampling time.
Outcomes and statistical analysis
The primary outcome of the study was the change from baseline to the end of the main portion of the study in the time in the target range (70–180 mg/dL or 3.9–10.9.0mmol/L) as measured by an FGM (Libre; Abbott Diabetes Care, Alameda, CA). Secondary outcomes included FGM-measured time below the range level 1 (TBR, < 70 mg/dL or 3.9mmol/L), time below the range level 2 (TBR, < 54 mg/dL or 3.0mmol/L), time above the range level 1 (TAR, > 180 mg/dL or 10.0mmol/L), time above the range level 2 (TAR, > 250 mg/dL or 13.9mmol/L), and coefficient of variation.
Safety outcomes included hyperglycemic crises and hypoglycemia events, as defined by the American Diabetes Association46. The Spanish version of the Diabetes Treatment Satisfaction Questionnaire was administered to all participants at randomization and the end of the study.
Exploratory outcomes included the agreement between the four-hour glucose prediction (DT engine) and the corresponding FGM data and the system’s usability scale47. Usability was assessed using the Spanish adaptation of the Computer Systems Usability Questionnaire (CSUQ), which ranges from 19 to 133 points, with higher scores indicating greater perceived usability. Additionally, a decision assessment was conducted after each use of the bolus calculator to identify any changes in insulin dosage, modifications in planned meal content, or a lack of action.
We hypothesized that participants in the SA-DSS arm would have a superior change from baseline to the end of the main study phase in the percentage of sensor readings within the target range (70–180 mg/dL) compared to participants in the BC arm. We estimated that 28 participants provide 90% power to detect a difference in TIR of 3.75% in the four-week intervention, assuming a standard deviation of 4%, a type I error rate of 0.05, and intra- and inter-subject variability of 5% and 9%, respectively48. A sample size adjustment to accommodate up to 10% losses to follow-up was planned48,49,50, but it was unnecessary.
Statistical analyses were performed according to intention-to-treat (ITT) principles. Mean ± SD and median (IQR) are reported for primary and secondary endpoints for normal/near-normal and skewed distributions, respectively. For the primary analysis, the change in the TIR from baseline to the end of the four-week observation period was compared between groups using a linear mixed-effects regression model while adjusting for pre-randomization TIR. We explored additional adjustment by type of insulin therapy (MDI vs. CSII), but given the small number of CSII users and the absence of any impact on the results, this variable was not included in the final model to avoid overfitting. No participants were on semi-automated or fully autonomous insulin delivery. The episodes of hypoglycemia and the number of hyperglycemic crises were compared using a ratio of incidence rates calculated using a Poisson regression51,52. For the agreement analysis, since the differences between methods did not follow a normal distribution, a non-parametric approach was used to estimate the limits of agreement53. It is essential to note that, to the best of our knowledge, there has been no thorough discussion on assessing the accuracy of glucose predictions for real-time insulin dosing in T1D. We selected an arbitrary threshold of 50 mg/dL based on an idealized 180 mg/dL peak in the postprandial state54. The potential clinical impact of the differences was evaluated using a surveillance error grid analysis55. No adjustment was made for multiple testing. All analyses were conducted using the R statistical package56. Some plots were generated in Matlab.