

Table of Contents
Genetic overlap between T2D and BP
We explored the genetic relationships between T2D and BP by evaluating the overall genetic correlation and associated loci that overlap between the two conditions. We performed linkage disequilibrium (LD) score regression using ldsc23 and observed a direct genetic correlation between T2D and SBP (rg[SE] = 0.25[0.028], p = 1.56 × 10⁻¹⁹), DBP (rg[SE] = 0.18[0.027], p = 1.38 × 10⁻¹¹), and PP (rg[SE] = 0.23[0.029], p = 2.25 × 10⁻¹⁵), consistent with previous research.
To further validate the LD score regression results, we constructed PGSs for T2D, SBP, DBP and PP in the UKB (Supplementary Table 1) using independent weights from GWASs (“Methods”). We probed whether a genetic predisposition towards one condition could predict the risk of the other using comorbidPGS24. T2D PGS was consistently associated with a modest increase in SBP, DBP, and PP (BetaPP[SE] ≥ 0.37[0.017] change in PP mmHg per one-unit increase in T2D PGS, p ≤ 1.83 × 10−106). SBP and PP PGSs were significantly associated with a higher risk of T2D (ORSBP[95% CI] = 1.07 [1.06–1.09] change in T2D odds per one-unit increase in SBP PGS, p = 9.36 × 10⁻³⁵; ORPP[95% CI] = 1.07 [1.06–1.08], p = 8.02 × 10⁻³¹). In contrast, DBP PGS had no impact on T2D risk (ORDBP[95% CI] = 1.01[0.999–1.02], p = 0.062, Supplementary Table 2).
We gathered a collection of 1401 SNVs associated with T2D, high SBP, DBP, and/or PP (“Methods”). We revealed 24/19/26 overlapping genetic loci between T2D and SBP/DBP/PP, respectively, determined by LD and/or genomic proximity (Supplementary Data 1). Of the 1401 SNVs, 9 were directly reported as lead signals for both T2D and BP traits. Additionally, we identified 97 SNV pairs that overlapped (within 500 kb or LD r² > 0.2) and were associated with T2D and BP traits. We observed several well-known loci, such as those at GRB14-COBLL1 (associated with reduced insulin level, pulse pressure, and mean arterial pressure)25,26, ADCY5 (beta cell function and lipodystrophy)27, and ACE (renin-angiotensin system, hypertension) genes28. Overlapping loci at JAZF1 (regulating glucose, lipid, and inflammation)29, ADRB1 (beta-adrenergic receptors regulating cardiac contractility and heart rate)30, TCF7L2 (controlling Langerhans islet proliferation)31, and SGIP1 (signalling in energy homoeostasis)32 contribute to the inverse relationship between T2D and BP. These results highlight the dense and complex genetic relationships between high BP predisposition and T2D risk.
Clusters of pathogenetic processes
To dissect the complexity of shared biological pathways between T2D and BP, we curated and refined the SNV list to 1304 independent variants (LD r² < 0.2), including 500 T2D-associated and 813 BP-associated SNVs, to cluster them based on their effects on 45 related (endo)phenotypes, including T2D/BP traits (Supplementary Data 2). Our investigation encompassed a wide array of related endpoints or risk factors, including biomarkers of inflammation and hepatic function, circulating plasma lipids, cardiovascular health indicators, anthropometric measures, glycaemic traits, and sex hormones (Supplementary Data 2). All SNVs (originally associated with T2D, BP traits, or both) were aligned to the T2D risk allele. When information for a particular phenotype at an SNV was unavailable, we used LD proxies (“Methods”)33, and performed imputation of the remaining missing data by random forest algorithm implemented in the imputeSCOPA software tool34. We used an unsupervised hierarchical clustering approach, given the anticipated heterogeneity within our SNV set induced by the inherent complexity in both T2D and BP signals35. To ensure robustness of our clustering, we ran extensive sensitivity analyses (“Methods”) with different sets of metabolic traits and other clustering methods, such as using Z-score adjusted for GWAS sample size, MRClust36 and Bayesian nonnegative matrix factorization (bNMF) (“Methods”, Supplementary Figs. 1–4). We identified five clusters of distinct pathogenetic mechanisms (Fig. 2), highlighting mechanistic heterogeneity in T2D-BP comorbidity. We compared the SNV assignments of our T2D-BP clusters with recent T2D hierarchical clustering9 and bNMF clustering37,38 (“Methods”, Supplementary Data 3, 4, Supplementary Figs. 5, 6). The pathophysiological processes identified across the five clusters were consistent with existing evidence and highlight mechanistic insights (“Methods”, Supplementary Figs. 4–7)9,12,37.
Each row corresponds to a GWAS of an endophenotype, while each column corresponds to a cluster (Supplementary Data 4). Colour represents the direction of the z-score (aligned to the T2D risk allele) from two-sided association tests between the GWAS and SNVs assigned to each cluster. Colour intensity represents the significance, expressed as −log(p value) from two-sided t-tests on the regression coefficients linking SNV cluster assignment with GWAS effect sizes. T2D type 2 diabetes, DBP diastolic blood pressure, UKB UK Biobank, PP pulse pressure, SBP systolic blood pressure, HbA1C glycated haemoglobin, RG random glucose, WHR waist-hip ratio, BMI body mass index, HDL high-density lipoprotein, PAI plasminogen activator inhibitor, ISI insulin sensitivity index, IGF insulin-like growth factor, LDL low-density cholesterol, adjBMI adjusted for BMI, HOMA homoeostatic model assessment, IR insulin resistance, B beta-cell function, WBC white blood cell count, CRP C-reactive protein, CAD coronary artery disease, TG triglycerides, SHBG sex-hormone-binding globulin, TRAIL-R2 TNF related apoptosis inducing ligand receptor 2, ALT alanine aminotransferase, AST aspartate aminotransferase, BMD bone mass density.
The Metabolic Syndrome cluster included 215 variants, and displayed the most distinct pathogenetic signature. It highlights attributes consistent with the metabolic syndrome, including lower levels of sex hormones (sex-hormone binding globulin, insulin, testosterone)39,40, higher central adiposity (waist-to-hip ratio [WHR] adjusted for body-mass index [BMI])41 without higher overall adiposity, measured by BMI, systemic higher IR evaluated by the homoeostasis model assessment of insulin resistance, HOMA-IR, using both fasting plasma glucose and insulin (alongside higher HOMA-B, proinsulin level, and insulin fold change), lower high-density lipoprotein (HDL) cholesterol, higher triglycerides (TG), and altered cardiovascular functions (higher heart rate, increased cardiovascular event risk, higher renin-angiotensin-aldosterone system activity)8. SNVs within this cluster also strongly associate with shorter stature (lower height) and lower birth weight.
Previous findings reported that shorter stature is associated with a higher risk of T2D42 and cardiovascular events38,43. Other studies linked greater height with insulin and insulin-like growth factor signalling pathways44. The impaired insulin sensitivity may be one of the underlying factors in this association45,46.
The T2D–high BP comorbidity is high in this cluster and was consistent with our bNMF clustering (Supplementary Fig. 3). The origin of the SNVs is an equal mix of T2D and BP (Supplementary Fig. 1). When comparing SNVs with previous T2D clustering, we observed an overlap between the SNVs in our Metabolic Syndrome cluster and the Type 2 Diabetes Global Genetics Initiative (T2DGGI) Metabolic syndrome cluster, as well as the bNMF cluster Lipodystrophy 1 (Supplementary Fig. 5).
In the Inverse T2D-BP risk cluster, we noted an inverse relationship of associated SNVs effects on higher T2D risk related to lower SBP/DBP/PP. Predominantly originating from associations with BP traits (Supplementary Fig. 1), the 353 SNVs within this cluster, when aligned to the T2D risk allele, are associated with a lower risk of cardiovascular events, such as atrial fibrillation (AF), coronary artery disease (CAD), stroke and heart failure. Additionally, these SNVs demonstrated associations with BMI and systemic higher IR (higher HOMA-IR). Comparison with previously reported BP-related clusters showed partial overlap with the Hypolipidaemia and Short stature SNV groups (Supplementary Fig. 6)38.
The Higher adiposity cluster contained 137 SNVs—predominantly T2D signals—which showcased effects on higher BMI, reduced sex hormones (testosterone and SHBG), higher TG along with lower HDL- and LDL-cholesterol, higher risk of cardiovascular events (CAD, heart rate, stroke), and insulin resistance (higher HOMA-IR/HOMA-B). This cluster, distinct from the Metabolic Syndrome one, showed a high number of obesity-related SNVs within previous T2D clustering (Supplementary Fig. 5). The Vascular Dysfunction cluster included 287 SNVs mostly originating as BP signals. They are associated with cardiovascular traits (higher risk of AF, stroke, CAD, heart failure), lower birth weight and show strong effects on both T2D–high BP. This cluster showed a number of hypolipidemia SNVs from previous BP clustering (Supplementary Fig. 6). Lastly, Reduced beta-cell function cluster exhibited characteristics of impaired beta-cell function including lower homoeostasis model assessment of beta cell function (HOMA-B), higher glucose/glycated haemoglobin levels (random glucose [RG], HbA1c), metabolic dysregulation (TG, sex hormones), higher inflammation (C-reactive protein [CRP], IGF-1) and taller stature (height). The Reduced beta-cell function cluster contained 312 SNVs, predominantly T2D signals, found in the Beta cell 1 and Beta cell 2 clusters from the latest published T2D bNMF clustering (Supplementary Fig. 5b).
The five distinct mechanistic groups of genetic variants, revealed through clustering, contribute to the shared susceptibility to T2D and high BP. They provide a foundation for further exploration of the biological pathways.
Multiomic characterisation of T2D-BP clusters
To further characterise the T2D-BP comorbidity clusters, we evaluated the changes in gene expression and regulatory elements associated with the clustered SNVs. We first conducted a colocalization analysis to elucidate the impact of studied SNVs on gene expression patterns. We explored the genomic landscape within a 200 kb window surrounding each clustered SNV to assess the likelihood of a shared causal variant between our clusters and gene expression changes across 50 tissues from various eQTLs datasets using a hypothesis-free approach and the coloc R package (“Methods”)47. We identified a total of 6321 colocalizations across the 50 tissues, involving 1558 genes and 448 clustered variants (Fig. 3a top, Supplementary Data 5, Supplementary Fig. 8).
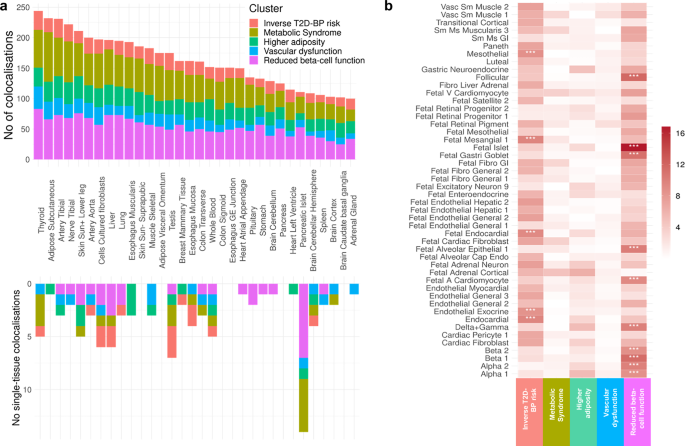
a Histogram depicting the distribution of colocalized loci across clusters in 50 human adult tissues (Supplementary Data 5, 6). Each bar represents the number of Bayesian colocalized signal (two-sided; PP.H4 > 0.8 and PP.H3 < 0.5) per tissue, with colours indicating contribution from the five clusters. The upper histogram shows the overall number of colocalizations while the lower portion highlights tissue-specific colocalizations. b Heat map showing the enrichment of open chromatin region across the five clusters and 222 cell types from 30 human adult tissues and 15 human fetal tissues (Supplementary Data 7). Each column corresponds to a cluster, and each row to a cell type. Colour intensity represents the −log(p value) from two-sided Chi-squared tests comparing nested logistic regression models assessing enrichment. Asterisks denote significant signals following Bonferroni correction for multiple testing (p < 2.25 × 10−⁴). No number, T2D type 2 diabetes, BP blood pressure, Sun+ sun-exposed, Vasc vascular, Sm smooth, Ms muscle, GI gastrointestinal, V ventricular, Fibro fibroblast, A atrial.
Our analysis revealed distinct gene expression signatures for each cluster, corroborating the diversity of the biological pathways involved. The Inverse T2D-BP risk cluster displays colocalization in the brain, particularly brain cerebellum (MGRN1, HELLS, SLC39A13) and adrenal glands (SLC7A1, RHOC, NUDT2). The Metabolic Syndrome cluster variants colocalized in adipose subcutaneous (JAZF1, ALKAL2, LCORL). The Higher adiposity cluster shows colocalization in skin (MYO19, EIF3C, SLC39A10) and whole blood (WFS1, CCDC134, MED27). The Vascular dysfunction cluster colocalized with fibroblasts (ERI1, FOXD4, RSRC1) and thyroid (CSTB, ZNF638, SNX31) and the Reduced beta-cell function cluster with pancreatic islets (C2CD4B, ADCY5, PHB).
We identified 99 tissue-specific colocalizations (Fig. 3a bottom, “Methods”). While thyroid and adipose subcutaneous tissues showed a high number of total colocalizations, pancreatic islets showed the highest number (14) of single-tissue (i.e., specific) colocalizations, particularly among the clusters strongly associated with risk of T2D such as the Reduced beta-cell function, Metabolic Syndrome and Higher adiposity clusters. Notably, the pancreatic islet tissue-specific colocalized genes include TH (synthesis of catecholamines)48 in the Higher adiposity cluster, MTNR1B (circadian rhythms and glucose metabolism)49, FXYD2 (Na,K-ATPase pump regulator)50, G3BP2 (cellular stress)51 in the Reduced beta-cell function cluster, SYNDIG1L (synapse development), LTBP3 (cell growth, differentiation and repair)52, CLEC18A (immune function)53 in the Metabolic Syndrome cluster (Supplementary Data 6). This demonstrates the predominant role of pancreatic islets in T2D pathogenesis and its related complications.
To explore the underlying mechanisms in the Inverse T2D-BP risk cluster, we conducted pathway analysis using Metascape54 for the 202 colocalized genes identified within this cluster (Supplementary Fig. 8). This analysis revealed an overwhelming enrichment in the retinol metabolic process (GO:0042572), which involves one of three compounds that make up vitamin A (retinol, retinal, and retinoic acid). All components of the retinol metabolism are associated with both T2D and CVD55.
We then dissected the localisation of our SNVs in a cluster-specific manner using chromatin accessibility atlases from CATLAS, based on scATAC-seq peaks. The atlas encompasses 222 cell types from 30 human adult tissues and 15 fetal tissues, allowing examination of the enrichment of candidate cis-regulatory elements (cCREs) in each cluster across different cell types (Fig. 3b and Supplementary Data 7). The clusters were enriched in diverse regulatory mechanisms. Specifically, the Inverse T2D-BP cluster exhibited significant (p ≤ 2.25 × 10⁻⁴) enrichment for regions of open chromatin in mesothelial cells, endocardial cells, endothelial in exocrine tissue cells as well as fetal endocardial and mesangial cells. The Reduced beta-cell function cluster demonstrated strong enrichment in several fetal cell types, such as islets, gastric goblet, alveolar epithelial, cardiomyocyte, as well as follicular cells and cells from the pancreas tissues, including delta, gamma, beta and alpha. This suggests that, beyond islet dysregulation and insulin impairment, pathways involved in fetal development also play an important role in adult metabolic health. Moreover, nominal enrichments were observed in fetal adrenal cortical cells for the Metabolic Syndrome and Higher adiposity clusters, suggesting hormone regulatory implications beginning as early as intrauterine development56.
Given the large number of colocalized SNVs observed across clusters in tissues such as the thyroid, subcutaneous adipose tissue, tibial artery, tibial nerve, and lower leg skin (Fig. 3a), we further explored the colocalized genes by identifying their enrichment in the primary cell types corresponding to these tissues—namely, follicular cells, adipocytes, smooth muscle cells, Schwann cells, keratinocytes (Fig. 3b). Notably, we identified 15 genes that both colocalized in thyroid and were enriched in follicular cell cCREs (Supplementary Table 3). While some of these genes were previously associated with T2D such as CAMK1D (energy homoeostasis and beta-cell receptor signalling pathway)57 or KCNH6 (insulin secretion and glucose homoeostasis)58, and with BP regulation such as ACE (renin-angiotensin system)28, the remaining are potential candidate genes for the T2D-BP pathogenesis. Among them are SAE1 (known in cancer)59, GSAP (known in Alzheimer’s disease)60, DCAF7 (cellular differentiation)61, MAP3K3 (stress and inflammation)62. Subsequent Metascape54 pathway analysis highlighted fundamental cellular processes, including protein ubiquitination (GO:0016567) and positive regulation of protein modification process (GO:0031401). The overlap of signals between colocalized genes and cCREs in the other four tissues consistently highlighted the MAP3K3 gene. Subsequent pathway analyses did not yield conclusive results (Supplementary Table 4).
Overall, changes in gene expression within clusters highlighted the importance of the thyroid tissue in T2D-BP shared pathophysiology and retinol metabolism within the Inverse T2D-BP risk cluster, while the high number of fetal cell regulatory elements enrichment suggests a strong contribution of intrauterine growth pathways in both T2D and high BP.
T2D-BP comorbidity using partitioned PGSs
To evaluate the ability of the T2D-BP SNV clusters to predict comorbidities and complications, we used the individual-level data from UKB and built unweighted partitioned PGSs for each cluster group. Using the R software environment tool, comorbidPGS, we aligned partitioned PGS to the T2D risk allele, i.e., each allele increasing the risk of T2D is counted as one in the PGS calculation (“Methods”)24.
To illustrate the influence of genetic predisposition, we computed the relative risk of comorbidity among the UKB individuals (“Methods”), based on the top 10% percentiles of each unweighted partitioned PGS. Whereas the overall prevalence of T2D-high BP comorbidity in the UKB was 5.49% (Fig. 4a), individuals in top 10% of the unweighted risk score of Higher adiposity, Metabolic Syndrome, and Reduced beta-cell function clusters had a relative risk RR[95% CI] of 1.36[1.32–1.41], 1.44[1.39–1.48], 1.55[1.51–1.60], respectively. Moreover, the individuals in the top 10% distribution of Metabolic Syndrome and Reduced beta-cells function combined PGSs, derived from 536 SNVs, showed a 2.13[1.96–2.31] fold increased risk of having comorbidity (Fig. 4b and Supplementary Table 5), reaching the same RR as a traditional pruning-and-thresholding (P + T) weighted T2D PGS. Survival analysis, using cumulative hazard plots, indicated that this elevated comorbidity risk was consistent and linear over 15 years of follow-up (year 0 representing the date of first diagnosis with either hypertension or T2D, Fig. 4c and Supplementary Fig. 11). This suggests that individuals with high PGS distributions remain at increased risk of comorbidity throughout their life course. Consequently, partitioned PGSs enhance the predictive ability to identify high-risk individuals at an earlier age63,64.
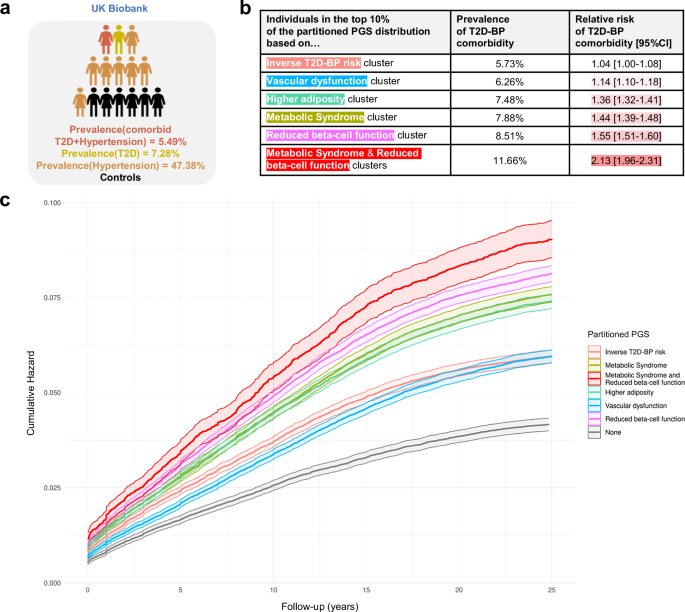
a Overall prevalence of individuals with T2D, hypertension, and T2D-BP comorbidity (Supplementary Table 5). Prevalence (\({\mbox{Prev}}=\frac{{{{\mbox{N}}}}_{{{\rm{cases}}}}}{{{{{\rm{N}}}}}_{{{\rm{total}}}}}\)) corresponds to the proportion of cases divided by the total number of individuals. b Summary table of the relative risk (\({\mbox{RR}}=\frac{{{\mbox{Prev}}}_{{{\rm{cases}}},{{\rm{cluster}}}}}{{\mbox{Pre}}{{\mbox{v}}}_{{{\rm{cases}}},{{\rm{overall}}}}}\)) of T2D-BP comorbidity for individuals in the top 10% of cluster-specific PGSs in the UKB, with 95% confidence intervals (CIs) derived using the Wald method on the log-transformed RR (Supplementary Table 5). Two-sided tests were applied throughout. c Cumulative hazard of T2D–BP comorbidity stratified by being in the top 33% of the unweighted partitioned PGS after clustering (Supplementary Data 10). Shaded areas represent the 95% CI of the two-sided estimated cumulative hazard from the Cox proportional hazards model. Prev prevalence, comorbid T2D-BP comorbidity, T2D type 2 diabetes, BP blood pressure, CI confidence interval.
Using the partitioned PGSs, we evaluated the association between PGS and multiple sets of complications based on the UKB hospital records (Fig. 5 and Supplementary Data 8). We detected a reciprocal protective effect of the Inverse T2D-BP cluster PGS on essential hypertension (OR[95% CI] = 0.91[0.90–0.92], p < 1.00 × 10−40) alongside other circulatory system disorders such as coronary artery disease (CAD, OR[95% CI] = 0.94[0.93–0.95], p = 5.08 × 10⁻²²), angina pectoris (OR[95% CI] = 0.95[0.94–0.97], p = 1.29 × 10⁻¹²), AF (OR[95% CI] = 0.96[0.94–0.97], p = 1.01 × 10⁻¹⁰), chronic ischaemic heart disease (OR[95% CI] = 0.96[0.95–0.97], p = 9.08 × 10⁻¹⁰). The Inverse T2D-BP risk cluster PGS also associates with lower risk of gout (OR[95% CI] = 0.92[0.89–0.95], p = 1.10 × 10⁻⁶) and hypercholesterolaemia (OR[95% CI] = 0.98[0.97–0.99], p = 1.90 × 10⁻¹⁷). These results support previous research on the heterogeneous effects of hypertensive medications on the risk of T2D, indicating that some biological processes between T2D and high BP may reduce the risk of comorbidity16.
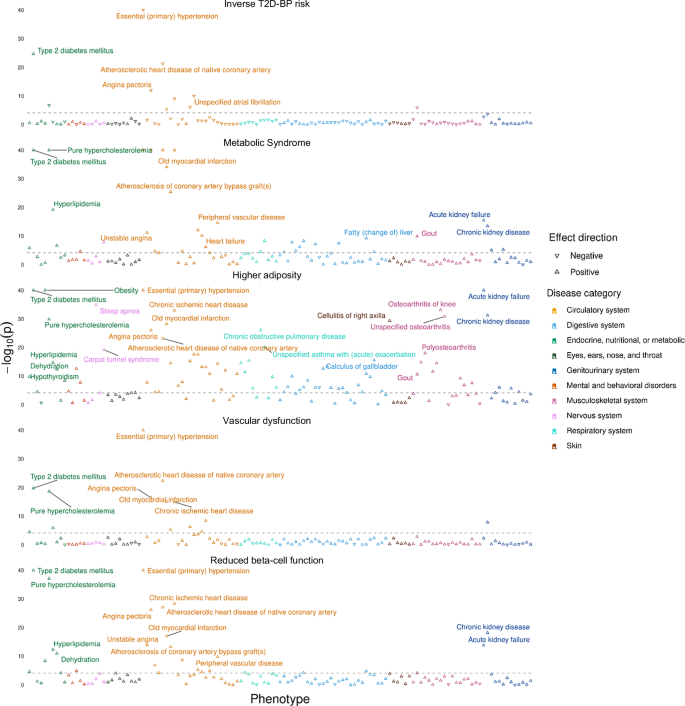
The figure displays five Manhattan plots, each representing results from two-sided logistic regression analyses testing the association between cluster-derived partitioned PGSs and disease risk (Supplementary Data 8). The grey dotted line indicates the threshold for significant associations applying Bonferroni multiple testing correction (p < 7.75 × 10⁻⁵). Arrows illustrate the direction of association between PGS and disease risk: upward-pointing arrows indicate that a higher PGS is associated with an increased risk of the disease, while downward-pointing arrows indicates that a higher PGS is associated with a decreased risk of the disease. Colours differentiate the different disease categories. PGS polygenic score, UKB UK Biobank, T2D type 2 diabetes, BP blood pressure.
We confirmed the high contribution into T2D-BP comorbidity of the Metabolic Syndrome cluster, by showing that its relatively small number of SNVs could predict risk of multiple metabolic disorders, including T2D (OR[95% CI] = 1.24[1.23–1.26], p < 1.00 × 10−40), hypertension (OR[95% CI] = 1.13[1.12–1.14], p ≤ 1.00 × 10−40), hypercholesterolaemia (OR[95% CI] = 1.10[1.09–1.10], p ≤ 1.00 × 10−40), hyperlipidaemia (OR[95% CI] = 1.10[1.08–1.13], p = 6.52 × 10⁻²⁰), fatty liver (OR[95% CI] = 1.13[1.09–1.18], p = 6.08 × 10⁻¹⁰), and hypothyroidism (OR[95% CI] = 1.03[1.02–1.04], p = 1.65 × 10⁻⁶). Additionally, the Metabolic Syndrome cluster PGS showed significant association with risk of cardiovascular complications such as CAD, angina pectoris, ischaemic heart disease, heart failure, and myocardial infarction. We also detected association with higher risk of kidney failure and calculus of kidney.
The Higher adiposity PGS showed the strongest risk prediction of obesity-related diseases, including T2D (OR[95% CI] = 1.22[1.20–1.23], p ≤ 1.00 × 10−40), hypertension (OR[95% CI] = 1.09[1.09–1.10], p ≤ 1.00 × 10−40), sleep apnoea (OR[95% CI] = 1.17[1.14–1.20], p = 1.28 × 10⁻³⁴), osteoarthritis (OR[95% CI] = 1.08[1.07–1.10], p = 1.51 × 10⁻³¹), carpal tunnel syndrome (OR[95% CI] = 1.09[1.07–1.11], p = 6.61 × 10⁻²⁰), and pneumonia (OR[95% CI] = 1.08[1.06–1.10], p = 3.92 × 10⁻¹²). This cluster PGS was associated with higher mental disorders, such as major depressive disorder, delirium or behavioural disorders due to use of tobacco, highlighting the intertwined relations between obesity and depressive conditions.
Among other clusters, the Vascular Dysfunction cluster was more predictive for cardiovascular complications, including hypertension (OR[95% CI] = 1.12[1.11–1.13], p < 1.00 × 10−40), CAD (OR[95% CI] = 1.06[1.05–1.07], p = 4.25 × 10⁻²³), or ischaemic heart disease (OR[95% CI] = 1.06[1.04–1.07], p = 1.05 × 10⁻¹⁵). The Reduced beta-cell function unweighted PGS showed the strongest association with risk of T2D (OR[95% CI] = 1.33[1.32–1.35], p < 1.00 × 10−40) and its related consequences, including obesity (OR[95% CI] = 1.03[1.02–1.05], p = 4.38 × 10⁻⁹), hyperlipidaemia (OR[95% CI] = 1.08[1.06–1.10], p = 5.17 × 10⁻¹³), fatty liver (OR[95% CI] = 1.09[1.05–1.14], p = 1.62 × 10⁻⁵), chronic kidney disease (OR[95% CI] = 1.10[1.07–1.12], p = 6.47 × 10⁻¹⁹), and hypothyroidism (OR[95% CI] = 1.03[1.01–1.04], p = 2.43 × 10⁻⁵). The Reduced beta-cell function weighted PGS (“Methods”) showed strong association with high SBP and PP, albeit not with DBP (Supplementary Data 9).
The partitioned PGSs effectively delineated the differences in prediction among the T2D-BP cluster SNVs. Partitioned PGSs shows that grouping of SNVs can highlight related comorbidities through different pathophysiological processes.